Birth day; Ahr 176.09 SOH 99.79%
One year; Ahr 164.28, SOH 93.13%
Two years; Ahr 162.57, SOH 92.16
6 month loss; Ahr 8.01, SOH 4.54%
1st year loss; Ahr 11.75, SOH 6.66% over 14,669.2 miles
6-12 month loss; Ahr 3.74 SOH 2.12%
2nd year loss; Ahr 1.71 SOH .97% over 13,012 miles
For the impatient, I started with the pertinent data. See a trend here? Granted, its only 2 years so might be hard to interpret. How about a picture?

Price of Gas
Like before, I seek out free charging when its convenient for me and generally its a lot during Summer but not nearly as much during Winter. This year has been different because EVCS is offering free charging thru out the Chademo ONLY West Coast Electric Highway until upgrades to CCS/Chademo (Yeah, that's right. Chademo lives!) are complete at which time they will offer WCEH special pricing. No info on that but the $20 unlimited plan is not likely to survive this change.
I am also lucky enough to have 3 Electrify America stations in town where all the Chademos work; an increasing rare occurrence it seems. So a visit or two on their free holiday weekends is almost a given.
Because of this, I almost maintained a balance of public charging with AC winning at 871.147 kwh over DC's 720.4539 kwh. All the AC was free while DC racked up $28.05 in charges. The "real" total is higher due to money on various accounts used but that money was spent long ago so not counted here since...well, the expenditure did not happen in 2021.
On the home front only $154.95 was spent to charge the LEAF. My highest cost per mile happened in Feb and for a few reasons and yeah, it was weather related. We had a huge snowstorm which meant February also had the lowest efficiency at 3.86 miles/kwh, lowest amount of free public charging (37.46 kwh) and home cost all tier two electrical rates. Despite all that, I still managed an "eye watering" 2.58 cents per mile (Yeah, its gasser eyes that are watering)
Speaking of weather, the 2nd lowest public charging use was June. This was a bit of a shock to me. My free AC charging mostly falls into two categories. Volta while at the movies or the mall and Telsa SC while biking the trail. SC Lacey has 4 Chargepoints that provide 2 hours free charging when Target is open and it borders The Chehalis Western Trail. Biking is not only good exercise but for me, its Zen for the mind so when the weather turns good, I am on the trail 3-5 days a week so lots of opportunities to grab some free electrons.
But this past June was when we had our all time heat wave and it was a doozy. With temperatures well over 100º, I wasn't about to hit the trail or much of anything else for that matter. During the heat wave, we had temperatures in excess of 30º above normal so it was all about hiding my LEAF from the heat in my "not so cool" garage but better than sitting in a parking lot during the hottest part of the day!
BMS
Nissan's BMS is designed to be user friendly which is a politically correct way of saying no thought processes, no options, no nothing. Then they made it worse by removing their one and only custom charge setting without an explanation and naturally we filled in the blanks as to why. So when I relay my manual BMS processes, this the typical response.
"I never know when I might have to go somewhere so we plug in immediately when we get home so our car is pretty much fully charged all the time. We like it that way. Ready to go."
"I have charged to 100% since day one and my battery is just fine. I have only lost one bar in 50,000 miles"
"Charging to 100% all the time is ok because the batteries are designed to be charged that way. That is why Nissan removed the 80% setting. It is simply no longer needed"
I could go on for days and back when we didn't have 100 miles of range and few public charging options, a lot of the concerns were quite valid. But the attitude persists with 200+ mile ranges and MUCH more charging options. Nissan doesn't help with their hidden capacities, very early dire warnings to plug in, etc. But that is how cars work. My Prius gas light came on about 3/16th of a tank. In a 500 mile car, that is nearly 100 miles. But we Americans tend to run out of fuel on a very regular basis so manufacturers will not be changing any time soon.
So I take it upon myself to control the SOC range I spend the most time. Despite this, my full charges increased from 2020 to 9 in 2021. Now you know how many longer road trips I did...almost. I had more than few leaving home at far less than 100% SOC but that was due to where I was going, what I was planning and time frame targets, etc. But ultimately, my goal is "living in the middle" SOC range that is.
How much I am helping my pack will likely take years to partially quantify. There are too many variables to driving style, location, terrain, weather, etc to compare my pack's stats to others (another reason I started the database of other LEAFers which was to be able to use THEIR PACK DATA) but I can say a few things that apply "most" of the time.
**Location doesn't matter nearly as much as previous packs which is most notable in the "not quite Hell" areas where its hot but not extreme but even in extreme areas like Phoenix, Gen two packs are doing much better.
**High milers benefit. Most over the degradation curve drive A LOT. By a lot, I mean over 30,000 miles a year. On the flip side, very low milers are riding below the curve although that is not as predominant and an early indicator says those who started out low on the degradation curve are gradually catching up to the pack.
** Time based degradation seems to have taken on a much greater role and the quarterly BMS adjustments seems to put an emphasis on that. For those unaware, unlike previous LEAF packs, the battery stats namely ahr and SOH do not bounce up and down several times a week like the gen one packs did. Now the numbers would slowly drop but every 90 days or so, the numbers would change dramatically gaining or losing chunks of rated capacity. For lack of a better term, I labeled this phenomena as "The Adjustment"
The Adjustment 2021
In my 2nd year the adjustments were kinder. MUCH kinder. Unlike the 4 in 2020 which were all drops, 2021 was a split with 2 drops, 2 increases with the overall change of nearly zero. (-.09 ahr, -.05 SOH) leaving only the downward drift between the adjustments to account for the year's capacity drop which was also better in 2021 so very much a win-win or simply the BMS learning my habits and needs and adjusting accordingly? The answer to that is a mystery to me so I am going to data dump ya and you can make your own conclusions.
Now that we have 2 sets of numbers to look at, some interesting statistics. First off, can't say how invaluable LEAF Spy is for this kind of stuff. I have archived EVERY LEAF Spy session covering all 5 LEAFs I've had (realizing of course LEAF Spy wasn't here in the early days of the 2011 and 12's) so being able to go back years to look for a specific data point is simply awesome. Below is a spreadsheet on the adjustments and it seems like every time I update it, I add more stuff to it. Not sure if the stuff is pertinent or helping to obscure the obvious but at least I can and LEAF Spy is the reason why.
First the chart
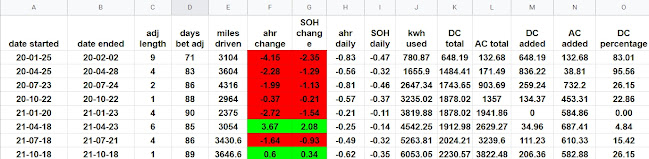
As always, you can click on the chart for a bigger, easier to read version. Ok, most of the headings are self explanatory so what I have going here
Adj Length; How long the adjustment lasted
Days bet adj; Should be obvious if you understand my abbreviations; days between the end of one adjustment and the beginning of the next
ahr and SOH change; Change during the adjustment
ahr daily and SOH daily; Change between adjustments
The rest of the data is how I charged between adjustments. Trying to see if too much DC was a bad thing. As you can see, I went way overboard on both options and basically determined its not what you charge with, its how you charge. A lot of DC is probably fine as long as you are charging to a reasonable level. In my case, my target SOC was generally 70% which basically kept the batteries surprisingly cool. More on that later. When collecting LEAF Spy data from other Gen 2's, I found no change in degradation rates based on the amount of DC charging. Maybe it was a change in NCTC or simply the additional range made it easier to pass up stations but hardly anyone relied even moderately on DC charging. Now more than a few of you will say DC charging is bad since that is also when I lost most of my capacity but my loss is not out of the ordinary even among people who DC'd rarely if at all so keep in mind, there is a lot more data going on than we see here.
Notice the date drift? More evidence its closer to a 90 day cycle than quarterly. Will need another year though to verify.
Interesting that I have had two one day adjustments both in October? One up, one down.
Speaking of the Oct 2021 adjustment; the gain only brought me back to even when considering the daily losses. Started the adjustment period with an ahr of 162.68 and ended with 162.66.
My largest negative adjustment was January of both years. This is a time of year where I generally drive less. Makes me think the car is hiding capacity from me to protect the cells maybe? More on that later.
In all metrics; Year one was much more severe than Year two.
Loss during adjustment;
2020 ahr; 8.79. 2021 ahr; .09%
2020 SOH 4.98%. 2021 SOH; .05%
Loss between Adjustment;
2020 ahr; 2.77. 2021 ahr; 1.57
2020 SOH; 1.62% 2021 SOH; .92%
So the real question now becomes will it continue to improve in year 3 or stay consistent?
**NOTE**
Not all numbers will jive with the above due to offsets of years, adjustments, etc. Top section is "birthday" stats based on the November 16, 2019 delivery date. These numbers here based on adjustments with the projected build date of approximately October 25, 2019.
Niggles
Ok so the car still has quirks. Listed below in no particular order. Only mentioned because...well, its a reality. Nothing here really matters a whole lot to me. Its like my phone. It doesn't always stay in its lane but the road is empty so not a priority for me. We all have our levels of acceptance so YMMV.
Steering wheel volume controls randomly do not function. Never lasts more than a single power cycle and ! still have the old school knobs which always work so guessing I have to say...Glad it aint a Tesla! But then again, they probably use an entertainment system with a higher degree of reliability.
When playing SAT radio, I will see random reboots of the center screen that I can just about predict to the second. Doesn't matter. With constant signal drops, its a bit irritating to listen to so I have passed on the last half dozen freebie periods. I will say Amazon Prime music seems to work quite flawlessly. Most of the time, I am listening to news radio anyway.
Air flow changes on its own. Seems to happen a lot more during Summer with A/C then any other time of the year so wondering if its simply a bad circuit design or insufficient ventilation causing issues due to heat buildup although I can't say that I have had experience with OEM equipment that even needed ventilation? Who knows? But it happens.
Huggables
As the years roll by, I have lost perspective on a lot of reasons why I love EVing. But the horrors of the alternative comes crashing back immediately after cranking up a smoke machine. With 3 distinct drive modes, driving has become a bit more fun. Its become a challenge of mine to go an entire month without touching the brake pedal one single time. (after startup of course) I am approaching my 4 year anniversary of E Pedal (2018 delivered February 16, 2018) and have yet to make it although I did make it past the 20th 3 times.
The Drive
My driving style has morphed during that time as well going from nearly 100% E Pedal to B Eco to the current D/B Eco. My change was encouraged by talking to John, a 2015 LEAF owner who rolled 200,000 miles on his original 24 kwh pack with 11 capacity bars.

And no, there is no typo in that last statement. Its a monumental achievement and so understanding how he did it was a no brainer. He charged to 100% every night at home, charged to 80% on DC to make it home every day. So what was his secret? Well due to his location, it was better to take the state highway to work than I-5 which would require driving thru a half dozen daily bottlenecks. The state highway was also a bit shorter but slower. Speed limit was 55 but slowed to a crawl driving thru every small town on the route. He admitted it took a bit more time but was also a much less stressful drive.
This got me to thinking on what effect higher regen and the accompanying higher level of power to regain speed had on the rate of degradation? We all know that cycling is a factor and one charge cycle rated as 0 to 100% so two 50% charge/discharge cycles is one cycle, 3 charging sessions adding 25% is one cycle, etc.
So my year 3 experiment (actually started last June) will be minimizing regen as much as possible. This means my primary drive mode is D Eco. I still use them all including N but the one thing I realized during my driving is I am constantly evaluating other drivers and predicting what they are going to do which causes me to completely remove my foot from the accelerator frequently for no more than a split second and I was doing this a lot. Since D has the flattest regen profile, I figured a smaller hit to the pack has to a good thing, right?
Projects for 2022
The big thing will be the driving style adjustment but when doing random experiments, I stumbled across other observations I will be repeating to see if its a fluke or simply an unnoticed fact of life.
One thing will be charging efficiency and how it relates to SOC. I saw a rather drastic variance on DC charging efficiency as the SOC rose. Efficiency would start out quite high but in charting a DC charge curve on EA one day, I noticed that my ability to predict the time EA would flip over on the Kwh counter was rather flawed. I kept missing it and couldn't understand why. So looking at the data later, I found that at high SOC, the charging efficiency was dropping significantly. I hadn't noticed because I so rarely (like nearly NEVER!) DC above 90%. So will be charting that to eliminate random car flukes, LEAF Spy data, batt temps, and whatever else I can think of.
Of course my pursuit of RapidGate continues. I didn't have a good chance at that last year mostly due to EA's dumbing down Chademo to 120ish amps. When 200 is possible, its hard to quantify if you can't stumble across a 200 amp machine conveniently located in the right spot. My Tahoe trip was derailed by wildfire although we did do the 10 Falls Hike in Oregon during REALLY hot weather but apparently it wasn't far enough and we did spend the night (although the overnight low was in the upper 80's) which probably made the difference. Even a few side trips home the next day didn't really matter. I will say I was surprised at how well the pack managed in 100º temps at 70 mph though.
HELP!!!!
Still need more LEAF Spy participants! The only way I can make this work is I need the same person to submit several data points over YEARS. Anything else is simply interesting. So thank you if you have been submitting shots on a regular basis...all 5 of you...Yeah, only 5 of you.
Another thing is if you have been saving your logs on Dropbox or something, you can pull out significant data and post them as well.
Date, ahr, SOH, HX, miles and L1/L3 count and I can work with that. Doing this gives us a better picture of how driving style, climate, location, and charging habits affect us. John is a perfect example that none of us really knows where the ceiling is. Did he simply win the traction pack lottery or is he the reason he has done so well?
Until next time!
No comments:
Post a Comment